How Do You Compare Different beer brewing equipment Options?
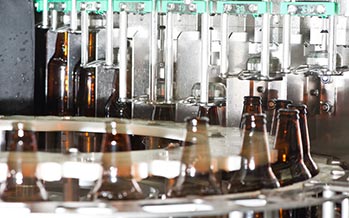
A useful beer brewing equipment comparison starts with measurable production requirements: finished beer per year, batches per week, vessel occupancy, brewhouse turns per day, cooling demand, labor hours, water use, and installed cost. A 10 BBL brewhouse running 6 batches weekly produces a theoretical 3,120 BBL across 52 weeks before process and packaging losses. Increasing vessel count may shorten the interval between batches, while adding fermenters may raise annual output more than buying a larger brewhouse. Compare working volume rather than gross tank volume, heating rate rather than heater nameplate alone, and installed cost rather than purchase price. Sanitary construction, local pressure-vessel compliance, CIP coverage, spare-part availability, and cooling capacity deserve the same attention as vessel size. The Brewers Association and Master Brewers Association also treat cleanability, water management, equipment maintenance, and food-contact design as measurable parts of brewery operation.
Start by converting the sales plan into equipment hours. A brewery targeting 3,000 BBL annually needs about 57.7 BBL of finished beer each week across 52 weeks. A nominal 10 BBL brewhouse therefore needs more than six weekly brews once fermentation, transfer, trub, dry-hop, filtration, and packaging losses are included. Comparing 10 BBL systems by tank diameter or purchase price misses the operating question: how many saleable barrels can each configuration make during the available production hours?
That calculation leads to brewhouse layout. A two-vessel system commonly groups mash/lauter operations and kettle/whirlpool operations, while three- and four-vessel arrangements separate more process stages so consecutive batches can overlap. If one configuration completes a turn in 6 hours and another reaches 4.5 hours under comparable recipes, the second can provide roughly 33% more theoretical turns within the same 18-hour production window. Supplier quotations should therefore include a vessel-occupancy schedule from mash-in through wort transfer rather than only a stated “batches per day.”
Ask each supplier to model the same recipe, grain bill, wort volume, original gravity, 2026 production schedule, cleaning allowance, and operator shift. Without identical assumptions, quoted throughput figures are not comparable.
Heating then becomes part of the throughput calculation. Electric elements can simplify smaller installations where sufficient three-phase electrical service is available; direct-fire systems require combustion and exhaust planning; steam-jacketed vessels add steam generation, piping, condensate handling, and maintenance. Steam equipment may cost more to install, but heat-transfer area and controllability can matter when several turns are scheduled daily. Published MBAA material has documented brewhouse energy-recovery designs reporting primary-energy savings above 25%, including a 200,000 hL example with more than 250,000 kWh of annual thermal-energy savings.
Once heating time is known, compare vessel capacity using working volume, not the largest number on the specification sheet. A fermenter advertised as 1,200 L may have a lower usable working volume because headspace is required for fermentation and process operations. Request gross volume, working volume, minimum practical fill, pressure rating, jacket coverage, cone angle, and dimensions separately. A brewery filling one 20 BBL fermenter with two 10 BBL brews also needs enough scheduling room to complete both turns before wort quality or yeast-management procedures become difficult.
Fermenter occupancy usually extends far beyond the brewhouse cycle, so cellar planning follows next. If an ale occupies a tank for 14 days and the brewery produces 6 batches each week, production can require roughly 12 batch-equivalents of fermentation capacity before allowing for cleaning, conditioning, scheduling changes, or slower products. A 21-day beer raises the requirement by 50% compared with a 14-day cycle at the same weekly brewing rate. Buying another fermenter may therefore increase annual production more effectively than increasing brewhouse volume.
Cooling capacity has to match that cellar schedule. A chiller specification should state cooling output at the intended glycol supply temperature and expected ambient conditions, because nominal horsepower does not show how much heat the system can remove during actual brewery operation. Compare wort-cooling demand, active fermentation, crash cooling, cold storage, bright tanks, piping losses, and simultaneous use. A system sized around average demand can struggle when three 20 BBL fermenters are crash-cooled within the same 24-hour period.
| Item to compare | What to request | Why the number matters |
|---|---|---|
| Brewhouse | Working volume, turns per 8/12/16-hour shift | Sets practical wort output |
| Fermenter | Gross/working volume, pressure rating | Defines usable cellar capacity |
| Chiller | kW or BTU/h at specified glycol temperature | Shows usable cooling performance |
| Heating | kW, BTU/h or steam demand | Affects ramp and boil time |
| Pump | Flow and pressure at operating point | Affects transfers and CIP |
| CIP | Flow, pressure, chemical volume | Affects cleaning time and water use |
| Controls | Manual/automatic functions and data logging | Changes operator hours and repeatability |
The next comparison is sanitary construction. Master Brewers notes that U.S. breweries fall under current Good Manufacturing Practices in 21 CFR Part 117 and that equipment must be designed so it can be adequately cleaned and sanitized. Its 2022 guidance also calls for enough facility space for maintenance and cleaning and regular inspection of seals, connections, and measuring equipment. A polished exterior therefore says little about sanitary performance; internal welds, drainability, product-contact surfaces, valve geometry, spray coverage, and accessible maintenance points matter more.
Request internal weld photographs, material certificates, pressure-test records, surface-finish specifications, jacket drawings, and a 100% list of product-contact components before approving fabrication.
CIP design deserves separate comparison because cleaning occupies equipment that could otherwise be producing beer. The Brewers Association maintains dedicated technical resources on brewhouse CIP, cleaning concentration, contact time, and sanitation, while MBAA literature has examined continuous versus burst rinsing because vessel rinsing can consume substantial quantities of water. A tank that takes 20 minutes longer to clean, repeated 300 times annually, adds 100 equipment-hours before labor, heating, chemical preparation, and rinse-water use are counted.
Water use connects cleaning performance to operating cost. The Brewers Association describes water consumption and wastewater disposal as ongoing economic and environmental issues for craft breweries and maintains dedicated water-management guidance. In 2026 it also noted that breweries can pay for both incoming water and wastewater treatment, while some water leaves through finished beer, evaporation, or spent grain rather than the sewer. Supplier comparisons should therefore record brewing water, CIP water, rinse water, cooling water, and estimated wastewater separately per batch.
Controls come after the mechanical and utility requirements. “Automated” may describe anything from digital temperature indication to recipe-controlled valves, pumps, water dosing, mash steps, alarms, trends, and CIP sequences. Compare functions one by one. If automation removes 45 minutes of manual work from each batch and the brewery runs 300 batches in a year, the difference equals 225 operator-hours annually. The saving can then be compared with the added cost of actuators, instrumentation, software, electrical panels, and future component replacement.
Pump and valve specifications should receive the same numerical treatment. A pump should be compared at the required flow and head rather than maximum flow with no system resistance. CIP may require a different operating point from wort transfer, while long pipe runs, elevation changes, elbows, heat exchangers, and spray devices increase resistance. Request pump curves, motor power, seal specifications, VFD range, valve sizes, and sanitary connection standards; a 15% difference in usable flow can alter transfer and cleaning times across hundreds of annual cycles.
At this stage, supplier comparison becomes more useful when every bidder answers the same specification sheet. hgmc brewing can be included alongside other equipment suppliers using identical fields: vessel working volume, stainless grade, material thickness, internal finish, design pressure, jacket area, pump model, valve brand, electrical standard, control functions, warranty period, lead time, commissioning scope, and recommended spare parts. A lower quotation is not necessarily a lower installed cost when freight, rigging, utility connections, controls integration, training, and commissioning sit outside the quoted scope.
Installation deserves its own cost line because a 2026 brewery project may involve electrical service, steam or gas supply, ventilation, glycol piping, floor drains, water treatment, compressed air, structural work, and equipment rigging before the first batch is brewed. Compare EXW or factory pricing only for procurement administration; compare operating-ready pricing for financial planning. If System A costs $180,000 but requires $70,000 of site work while System B costs $205,000 with $35,000 of equivalent work, the installed comparison becomes $250,000 versus $240,000.
Physical dimensions can overturn that comparison. Record ceiling height, tank diameter, doorway width, shipping orientation, floor loading, service clearance, platform access, and motor-removal space before ordering. A 4-inch difference in vessel diameter can determine whether an existing doorway is usable. MBAA guidance specifically notes that brewery and cellar layouts need enough space for appropriate equipment maintenance and cleaning, so clearance should be treated as an operating requirement rather than unused floor area.
Regulatory documentation comes next because pressure vessels, boilers, gas appliances, refrigeration, electrical panels, and food-contact equipment can fall under different local requirements. For a U.S. brewery, equipment sanitation also sits within the broader cGMP framework described under 21 CFR Part 117. Ask suppliers which standards were used, which components carry recognized certifications, who provides pressure documentation, and whether modifications after delivery can affect approval or warranty coverage.
Maintenance costs should then be added over a realistic ownership period, often 5 or 10 years for financial comparison even when stainless vessels remain in service much longer. List pump seals, valve seats, temperature probes, pressure transmitters, heating elements, motors, VFDs, actuators, gaskets, spray devices, and control hardware. If a $300 component stops a 10 BBL brewhouse for 3 production days, lost scheduled output can exceed the price difference between stocking several spare components and waiting for international delivery.
Supplier service can be measured rather than described with vague terms. Ask for warranty duration, normal technical-response hours, remote diagnostic access, commissioning days, technician travel terms, spare-part location, and references from at least 3 breweries using equipment of similar capacity. A reference operating a 3 BBL taproom system provides limited information about a buyer planning 30 BBL multi-turn production, even when both systems come from the same manufacturer.
A final financial comparison can place every option on one sheet:
-
Purchase price plus freight, rigging, installation, utilities, commissioning, and training.
-
Annual labor hours based on the same number of batches; a 20% labor difference should be converted into hours and payroll cost.
-
Water, electricity, gas/steam, refrigeration, chemicals, and wastewater per BBL or hL.
-
Planned maintenance and spare parts across 5 years.
-
Practical annual production after fermentation, cleaning, maintenance, and packaging schedules.
-
Expansion cost if annual volume rises 25%, 50%, or 100%.
Use the same 52-week production calendar for every option and run at least three demand cases—for example 2,000, 3,000, and 4,500 BBL per year. A system that appears expensive at 2,000 BBL may use labor and cellar capacity differently at 4,500 BBL. Keep assumptions visible beside every result, especially fermentation days, brewhouse turns, packaged-beer losses, utility rates, staffing, and scheduled maintenance.
The comparison is ready for purchasing only when production capacity, cellar occupancy, heating, refrigeration, sanitation, utilities, installation, compliance, maintenance, and supplier support have been measured on the same basis. Industry guidance from the Brewers Association and Master Brewers continues to emphasize clean equipment, controlled sanitation, water management, and consistent maintenance rather than judging brewery hardware from nominal capacity alone.